Palmoil.io Newsletter - March 2025
Learn about our new jurisdictional dashboards, CPO volume and value stats, new Risk Insights, and upcoming webinar.

What’s new?
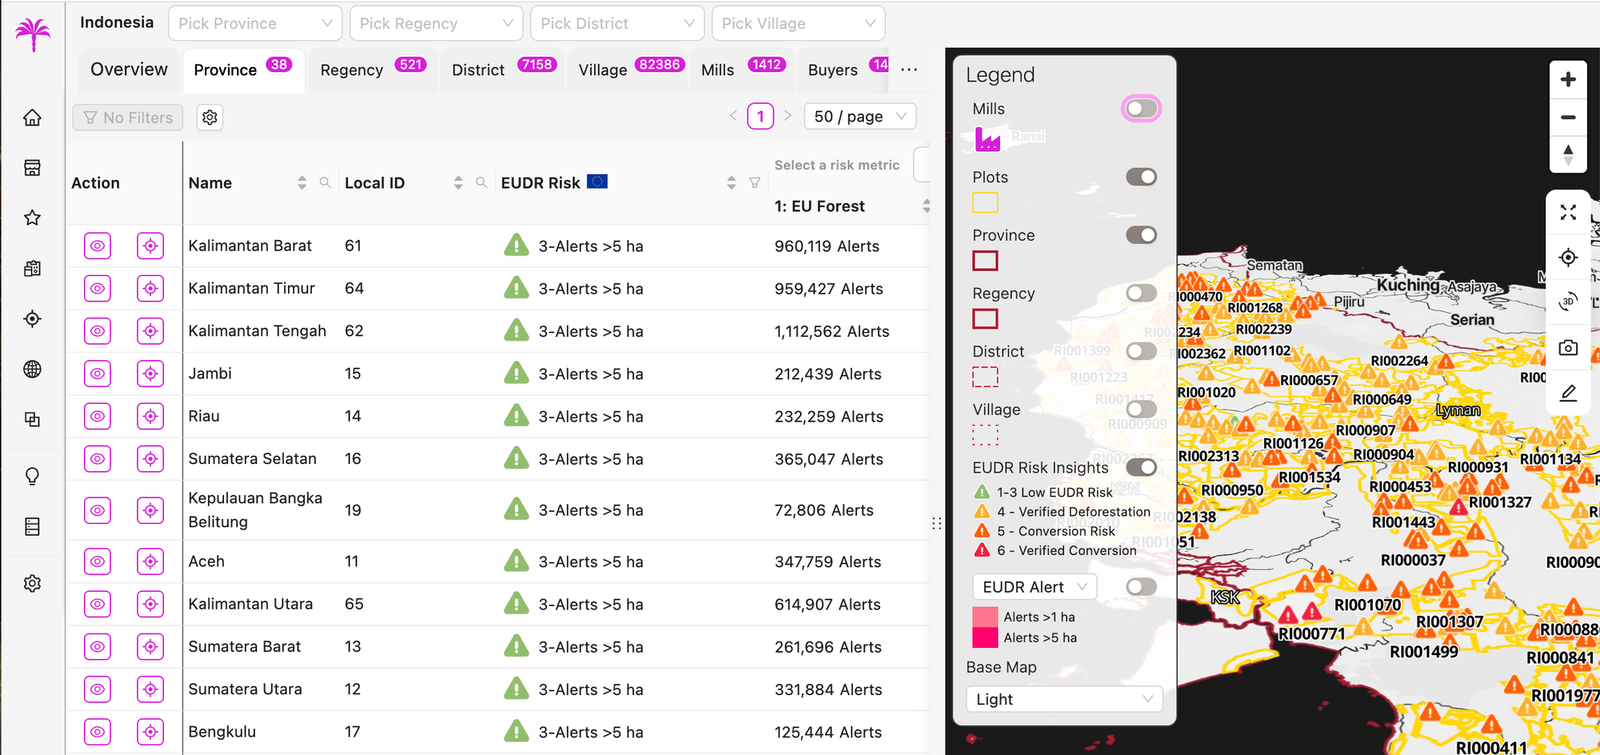
Jurisdictional Landscape Dashboard
The wait is finally over — our Palmoil.io Jurisdictional Landscape Dashboard is live! dashboard enables you to assess EUDR/NDPE deforestation, palm production, GHG emissions, grievances, supply chain relationships, and other supply chain risks from the province down to the village (desa) level. The dashboard covers over 84,000 villages in Indonesia, with plans to expand to other regions in the world soon.
Screen Landscape Initiatives

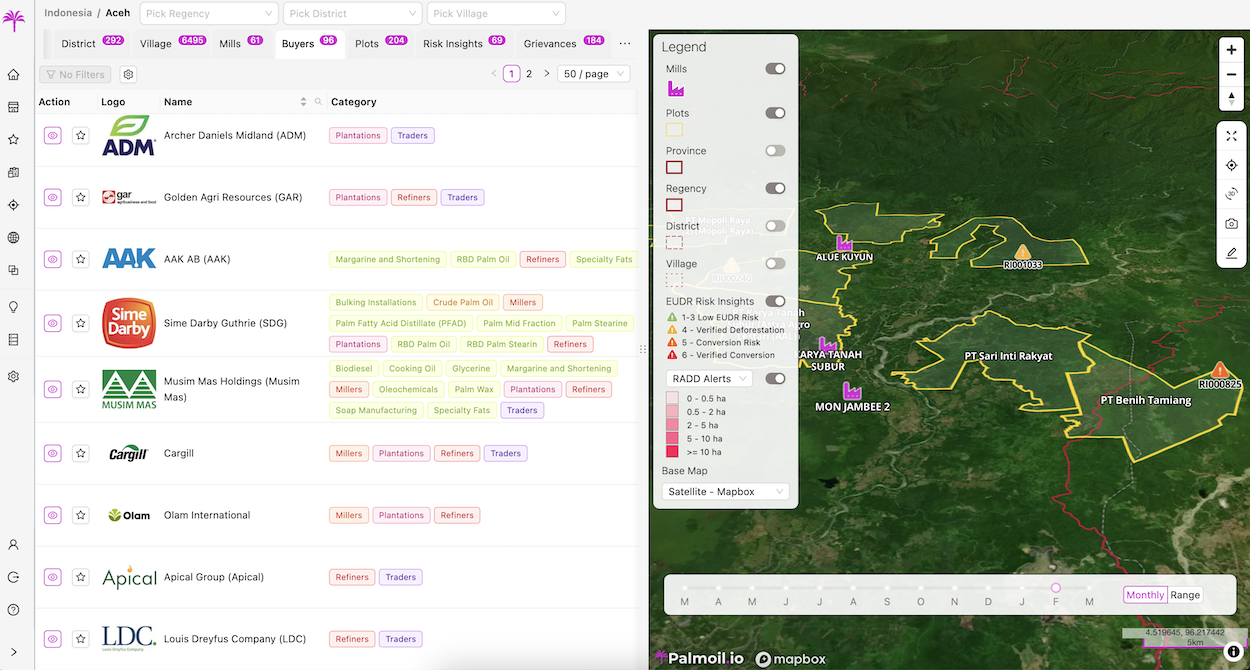
Jurisdictional dashboards provides the critical tools for screening and monitoring jurisdictional initiatives. This will aid project investors assessing and monitoring potential investment opportunities, providing monthly deforestation stats, annual emissions, conservation potential, and grievance tracking. For project developers, dashboards helps find suitable jurisdictions to invest in, assess existing with our EUDR/NDPE risk ratings derived from our peerless mill and plot data, and critically find potential customers by seeing who buys from each jurisdiction.
To learn more, please join one of our upcoming jurisdictional webinars. The details are in the 'What's Coming Up' section below. Our jurisdictional dashboard was generously supported, in part, by a grant from the David and Lucile Packard Foundation.
New Pricing Tiers
We have new subscription tiers for everyone, so it’s a perfect time to get started with Palmoil.io. For individuals or small teams, the Starter Tier, with a new lower starting price, will get you basic deforestation monitoring with global data, deforestation alerts, mill lists, and traceability. For deforestation monitoring and EUDR risk mitigation, the Advanced Tier includes the global grievance database, EUDR ,NDPE, and DCF metrics, plot analysis, risk reports (monthly), and jurisdictional dashboards. For large supply chains (organization-wide access), the Enterprise Tier adds EUDR DDS compliance, unlimited reports and dashboards, GHG/carbon data, custom grievance tracker, and API access. Contact us for more details at palmoil.io/#pricing or support@maphubs.com
Plot CPO volume estimates and values

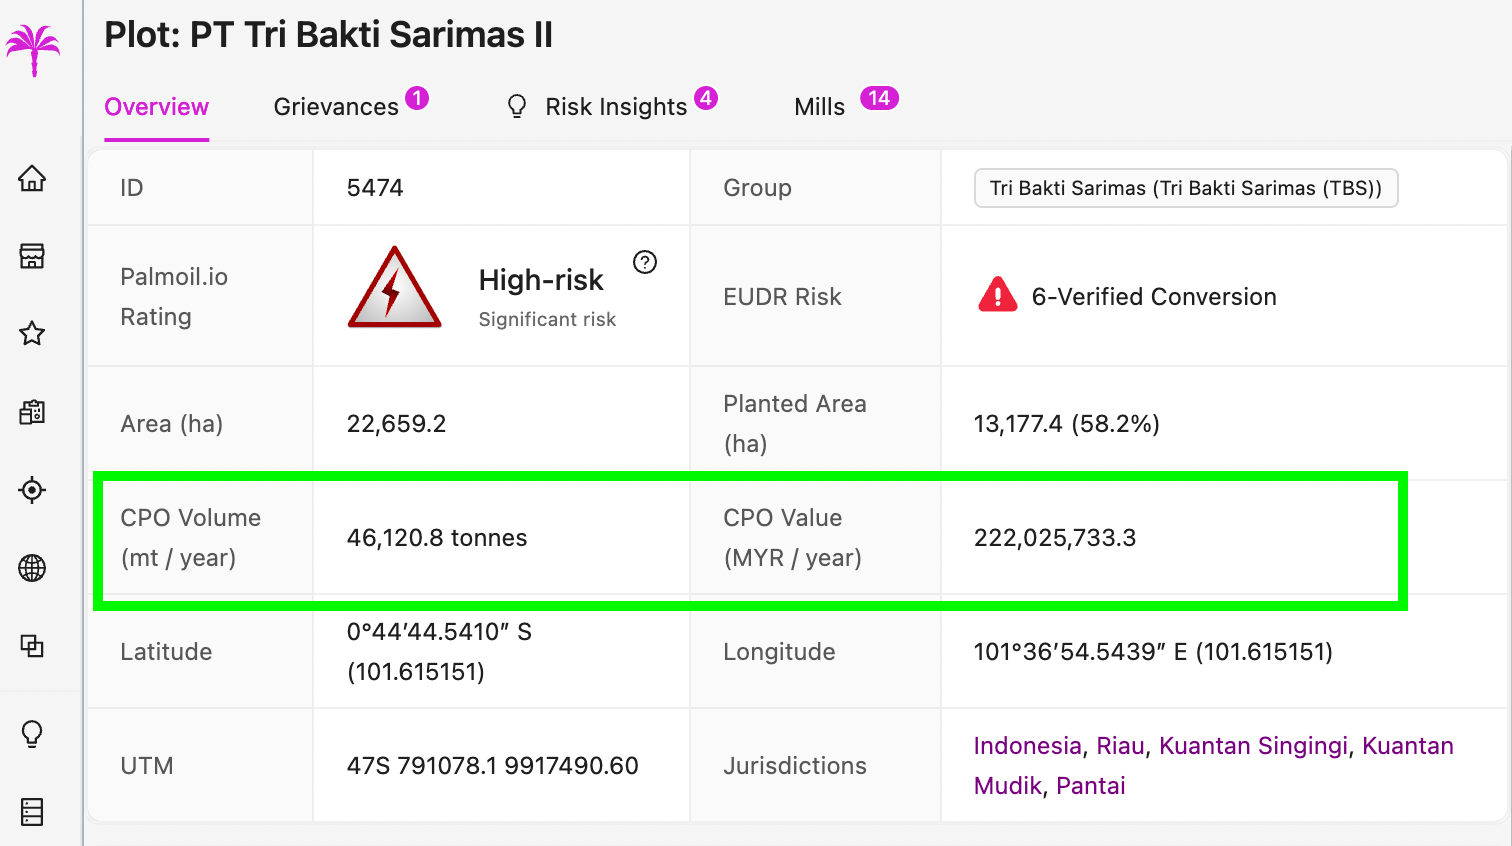
All plots now feature the estimated annual CPO volume and value in Malaysian Ringgit (MYR). We based this data on the average yield/ha and current CPO price per ton. Plot volume and value not only gives insights into important plantations for production but when combined with our risk information, it will also identify major plantations that may not be compliant for EUDR or NDPE supply chains.
New Risk Insights
Exciting News! We’ve now doubled our risk insights with over 2,300 reports. Approximately 30% of plots in our database now have Risk Insight reports. As you know, we analyze and review satellite imagery to identify the causes of deforestation, link supply chains, and map transport routes. Our expert analysts carefully verify deforestation alerts to both confirm whether forest conversion to non-forest areas has occurred as well as identify the cause. We then compare the before-and-after conditions to assess the impact. Each report includes a summary of the verified deforestation status, giving you clear and actionable insights.
Our focus has been to fully cover 2022-2023 deforestation for EUDR and more recently planted palm that may begin to enter the supply chain and be a risk for the EU.
What’s coming up?
Palmoil.io Webinar: Jurisdictional Landscape Dashboard Launch
A launch isn’t official without an in-depth webinar! We're excited to announce the upcoming Palmoil.io Webinar: Jurisdictional Landscape Dashboard Launch on:
Session 1 (EU): Wednesday, April 16th at 09:00 EDT / 15:00 CEST. Click here to register https://app.livestorm.co/maphubs/palmoilio-webinar-jurisdictional-landscape-dashboard-launch-1?s=009f5ad7-dfed-4261-b7a8-39159dc6adda
Session 2 (Asia): Thursday, April 17th at 10:00 WIB / 11:00 MYT. Click here to register https://app.livestorm.co/maphubs/palmoilio-webinar-jurisdictional-landscape-dashboard-launch-session-2?s=d36ff3cb-1df2-46e3-90fa-96b8526a13d0
Join us as we walk you through the different data sets and features in this latest addition to Palmoil.io. Don’t miss this chance to explore the insights and functionality of the new dashboard! Register here for Session 1 and here for Session 2. See you there — and don’t forget to prepare your questions! We’ll be answering them after each session.
Palmoil.io Risk Ratings
We are introducing a new initiative to simplify deforestation and conversion-free risk assessments with Gold, Silver and Bronze supplier ratings, where we have rated the supply chain of hundreds of companies for forest and peat conversion and other identifiable risks. All of the ratings are based on both our deforestation and conversion-free data and additional risk inputs.
We are soft launching plot ratings, with ratings for mills and processing facilities to follow. Palmoil.io risk ratings will make it simple for you to comply with regulations or gain recognition for your sustainability efforts. For more information contact us at support@maphubs.com or visit palmoil.io/solutions/ratings
Tip of the month
Introduction to Risk Insights (Help Center)
We’re constantly updating our Help Center to keep you informed about our exciting new features and improvements. Since our Risk Insight reports have become such an important part of Palmoil.io — providing valuable information on deforestation — we’ve updated the Introduction to Risk Insights in our Help Center to reflect the latest layout and structure of our reports. You can check out the updated version below:
As you know Palmoil.io publishes monthly Risk Insights reports (RIs), which document high risk mills and plots/concessions for recent deforestation, historical deforestation, or threatened remaining forest or peat. RIs are linked to a plot/concession or to a mill in proximity to the deforestation.
Benefit of the month
Grievances through Plots
Did you know you can easily find grievances linked to any plots using the plots table in Pamloil.io? This makes identifying grievances much easier than before. Simply open the plots table and scroll through the columns to find the grievances, or use the “Hide & Order Columns” feature to display only the data sets you need. This allows you to quickly see which grievance reports are connected to specific plots — including those with multiple or identical grievances. It also helps you identify cases that are unresolved or disputed without evidence more efficiently.

