Palmoil.io Newsletter - February 2025
We cover our recent webinar on our Portfolio feature, Leo's trip to POC, our new drawing and measurement tool, and an update on our jurisdictional dashboard.

What’s new?
Feature Highlight On-Demand: Portfolio
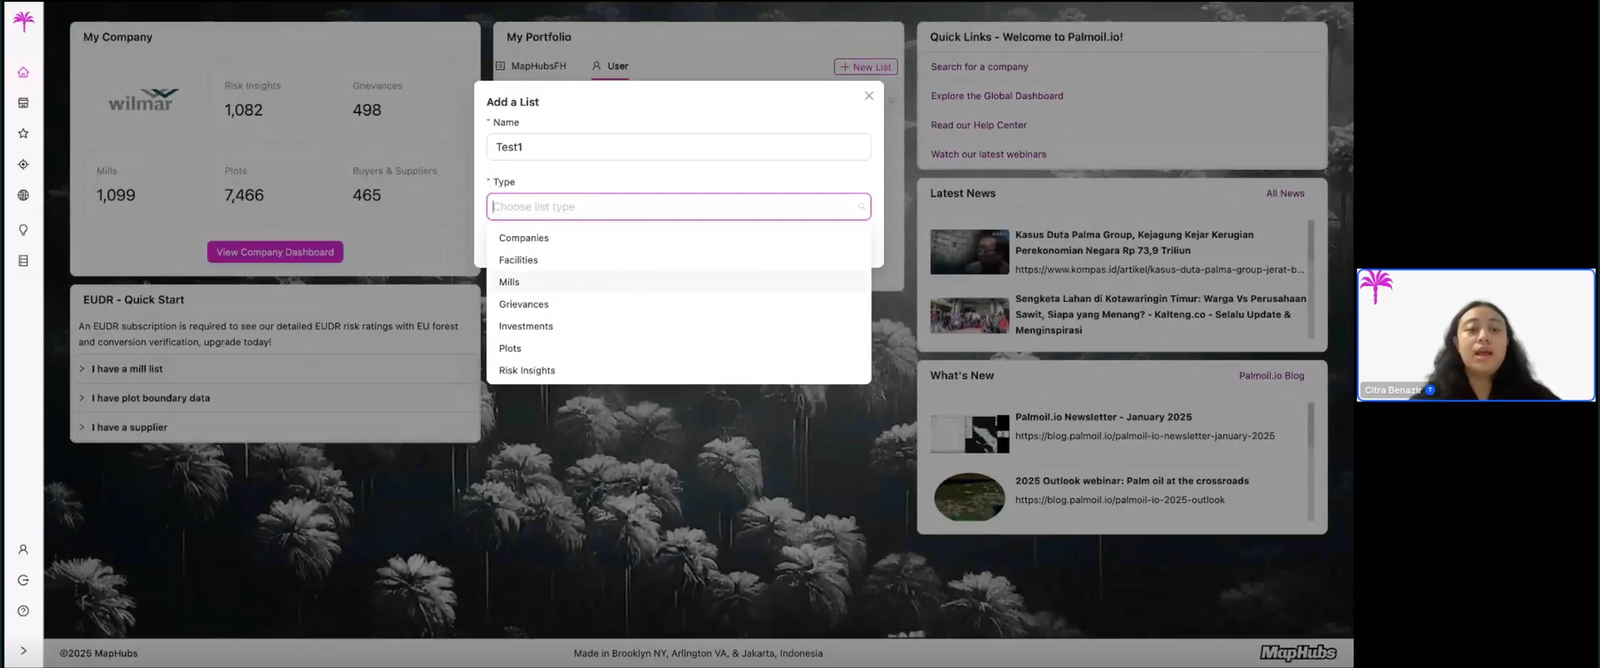
We have another feature highlight for you, but this time it is available directly on-demand. So you can watch it here straight away. We'll walk you through the Portfolio feature—your private monitoring dashboard that helps you track and analyze critical insights with ease. With Portfolio, you can customize your monitoring by saving mills, uploading lists, and even adding custom locations, including non-palm oil areas. Portfolio allows you to easily track and analyze key places. Try it today, and if you have any questions, please contact us at support@maphubs.com.
Leo attends POC 2025

Our CEO, Leo Bottrill, attended the annual POC conference in Kuala Lumpur, Malaysia - one of the largest oleo industry conferences in the world. Leo met with numerous palm growers, refiners, oleochemical manufacturers, and consumer goods companies. The EUDR was a common thread in all his conversions. The industry still considers the EUDR a major priority and a challenge for companies linked to PKO supply chains. Many are still hamstrung by a lack of plot data transparency from their suppliers.
Despite challenges, the message coming from industry to the EU was clear. We need certainty. Further delays, changes, and clarifications make practical planning near impossible, so it is critical that the EU continue as planned so companies can make the necessary plans and investments. While this perspective may not be shared by other in scope commodities, it is clear that palm industry plans to be ready and EU operators were pushing their suppliers to disclose risks.
Leo also met with a number of Palmoil.io subscribers who shared anecdotes on how Palmoil.io's Risk Insights had provided critical evidence for addressing deforestation risk linked to their suppliers. The satellite evidence in Risk Insight reports documented conversion cases that were potential violation of both their NDPE policies as well as presenting EUDR compliance risks.
New Features: Drawing & Screenshot Tools
We are excited to announce a new feature in Palmoil.io. We are constantly looking for new methods to help your work in Palmoil.io, which is why mapping and screenshot tools are a welcome addition.
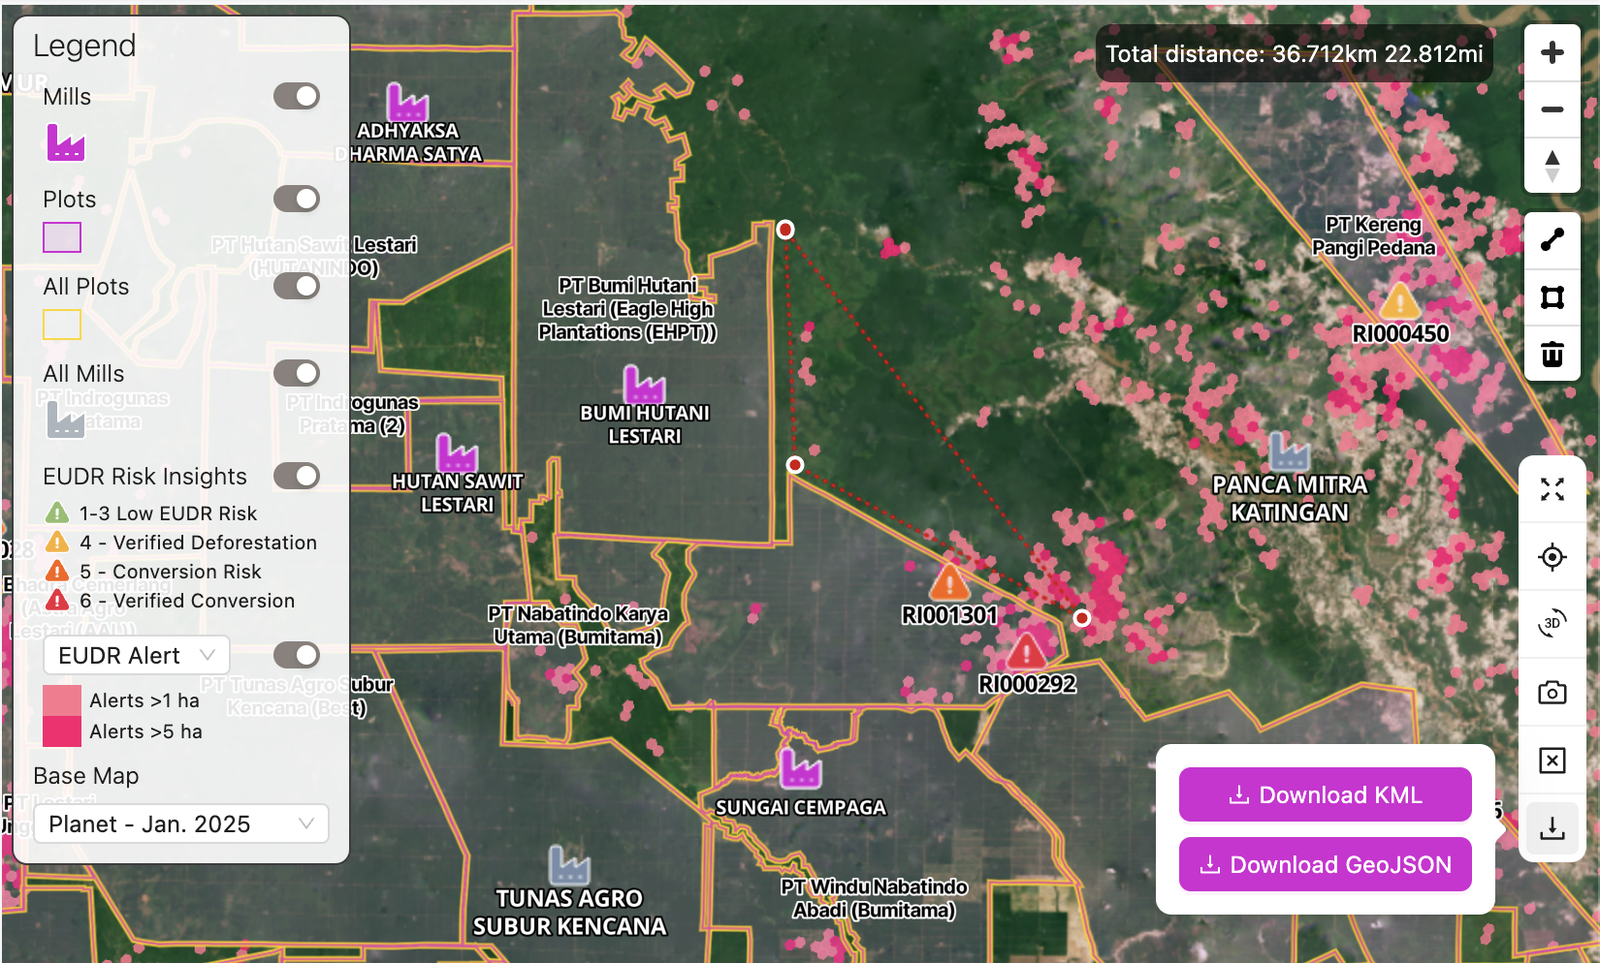
Drawing and Measurement Tool
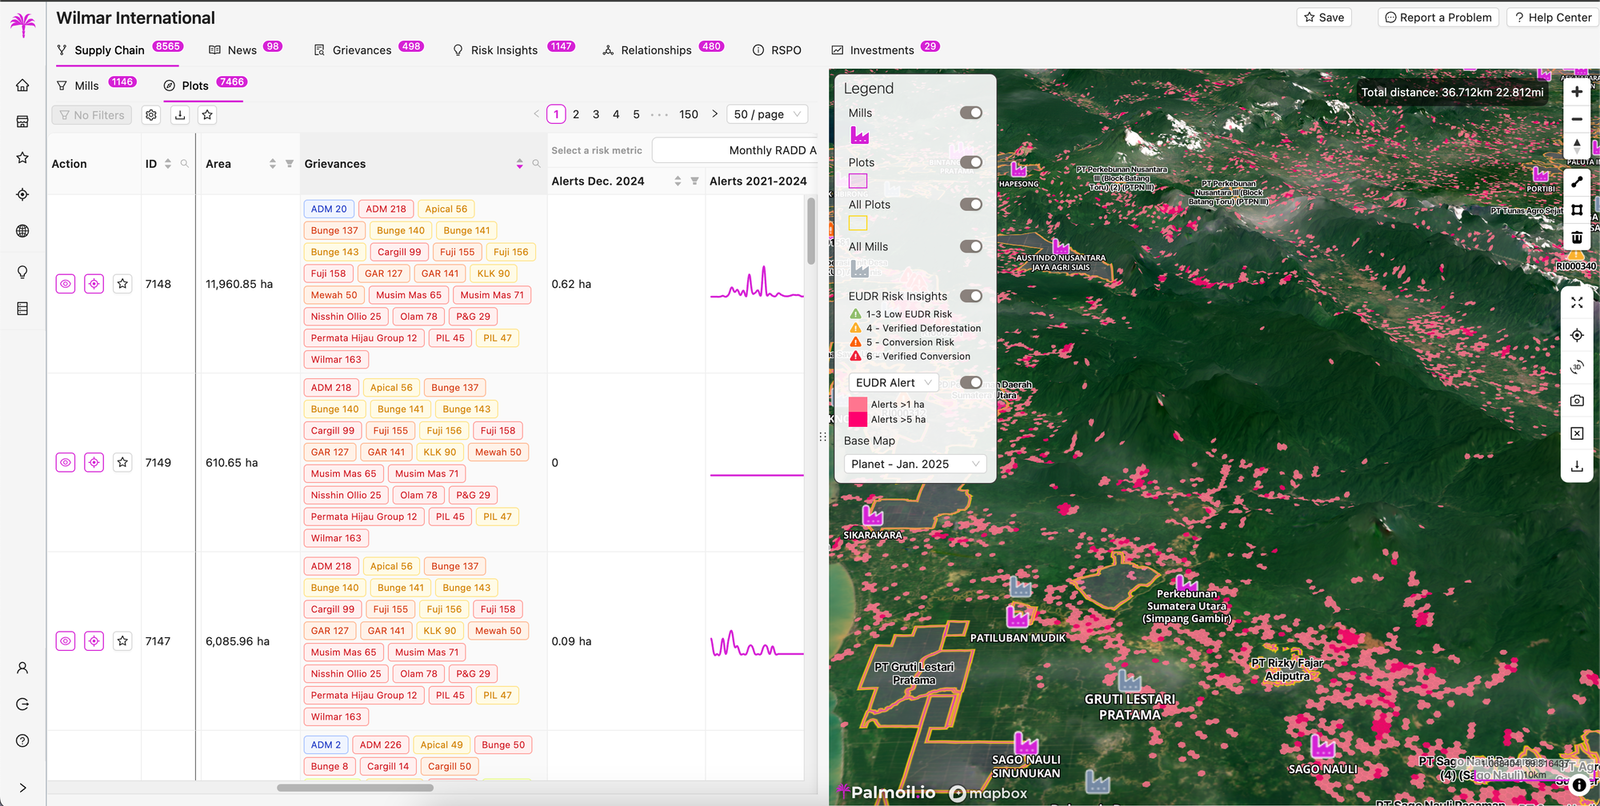
Drawing and Measuring Tool on Palmoil.io Maps
First, we have a new drawing tool on the right side of the supply chain map that allows you to manually draw on the map, to measure an area
- Click the drawing tools icon
- Select line or polygon, draw your map feature and double-click to finish it.
- The length or area will display in the top right corner
- Next you can take a screenshot of the map or download your drawing it as a KML or GeoJSON
How does this help?
- Map an area of deforestation and get the area in hectares
- Draw a box around an area you want to point out in your map and take a screenshot
- Measure the length of a road or the border of a plantation
Map Screenshots
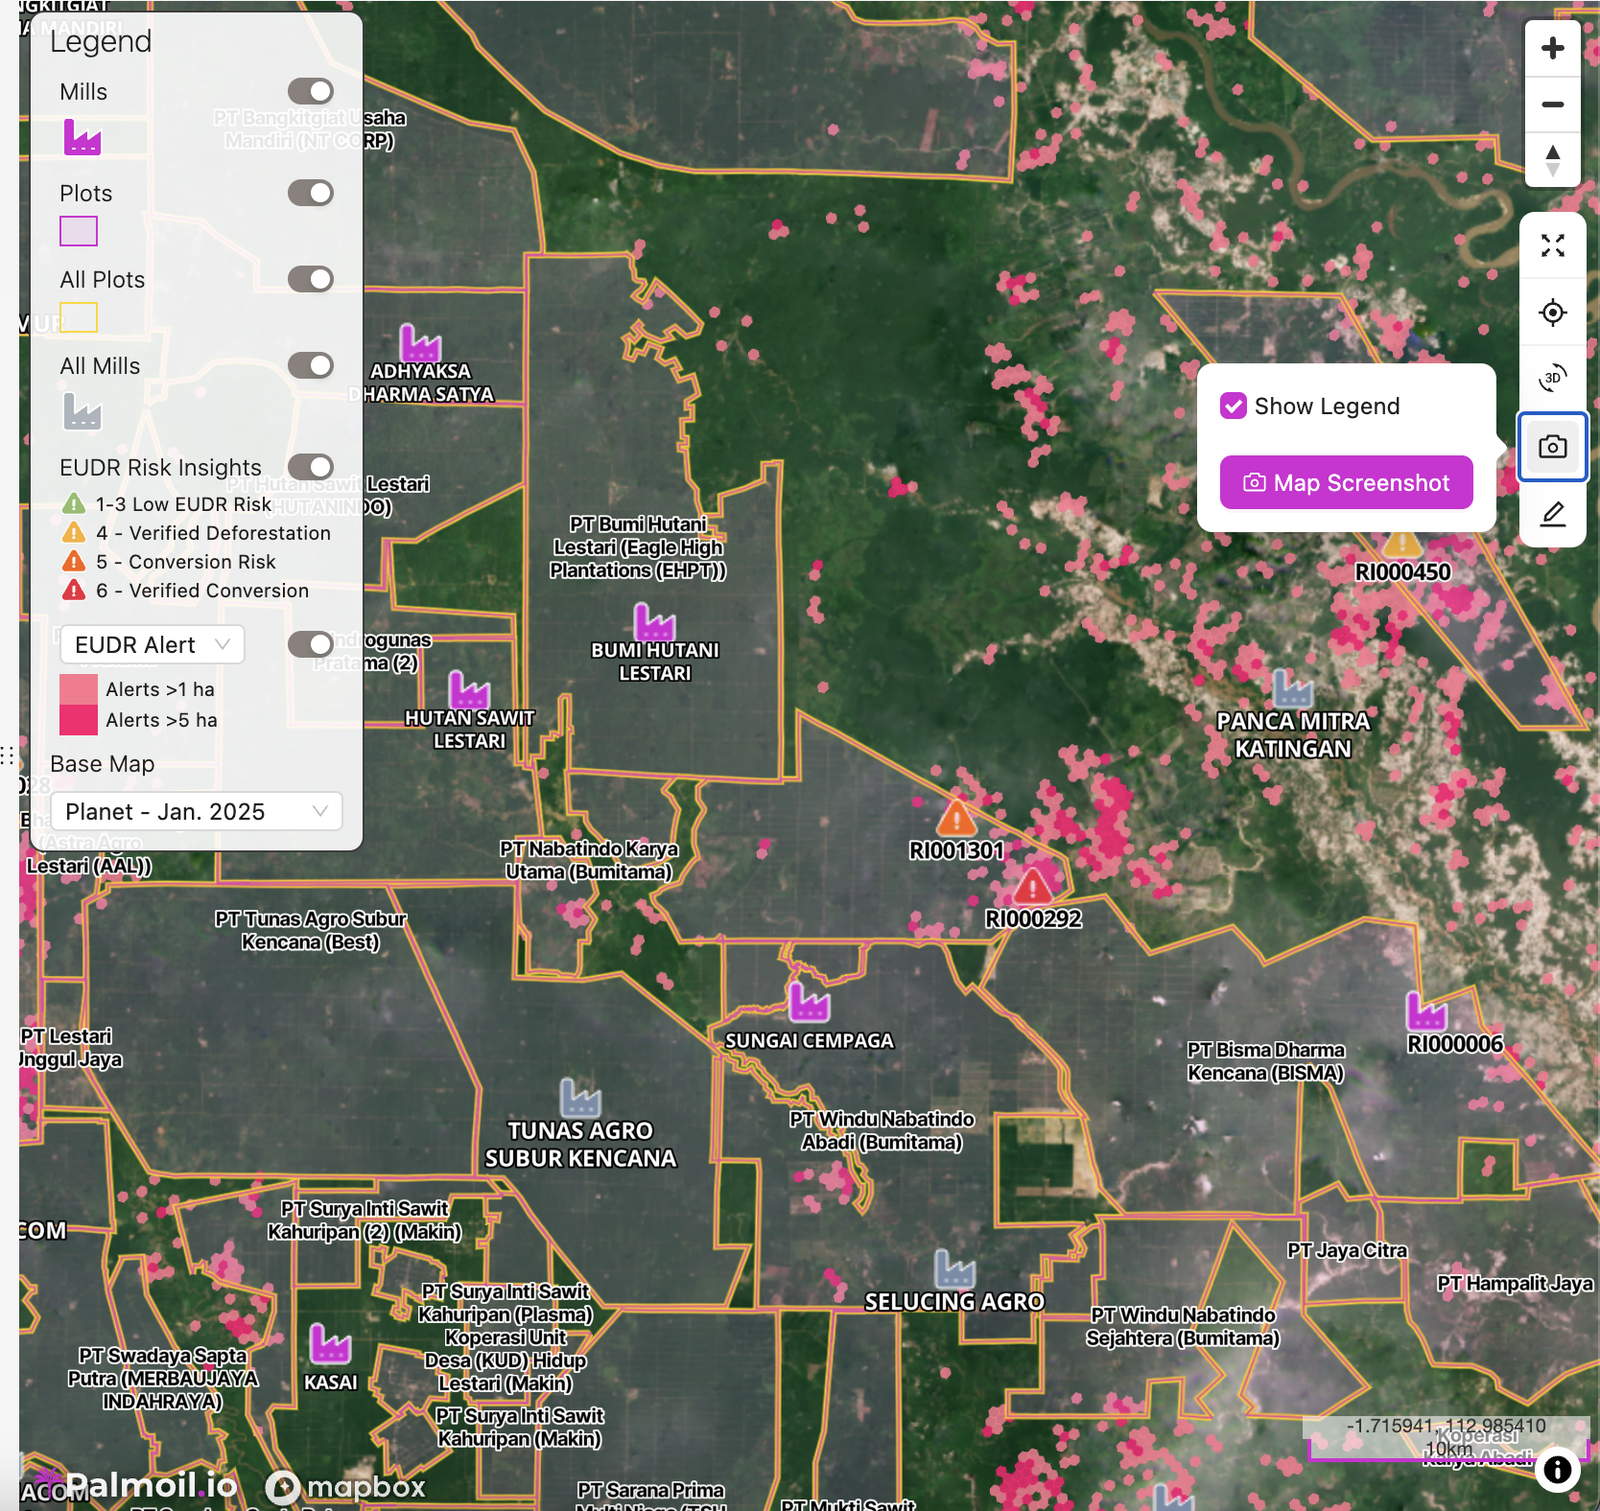
Another feature is the screenshot tool, which can be found directly above the drawing tool and allows you to choose an area of interest and click the "Map Screenshot" button to take a good, clear image of that region. You can include or exclude legends. We hope this is a nice complement to your Palmoil.io experience.
What’s coming up?
Jurisdictional Landscape Dashboard coming very soon!
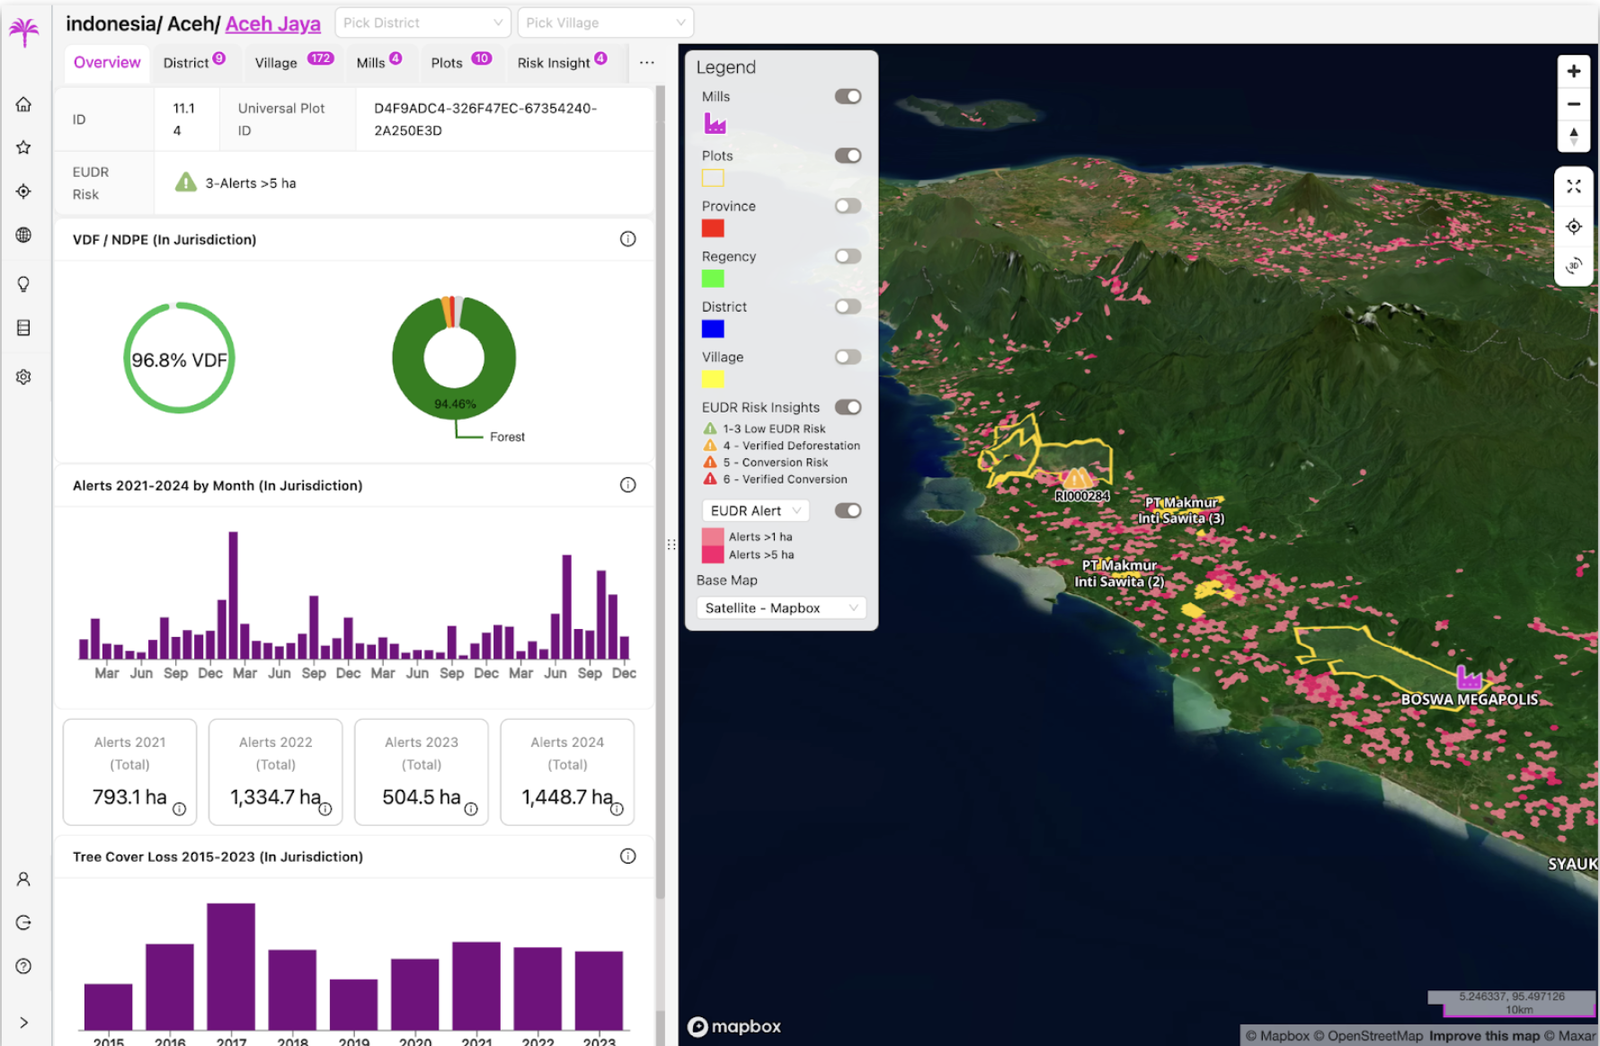
To those who attended our Palmoil.io Outlook Webinar 2025, you already know that we are still working on the highly anticipated Jurisdictional Landscape Dashboard. It’s coming very soon so be sure to be on the lookout for it. We will be starting with Indonesia for a start, with data from the country to village level. To refresh your memory, this jurisdictional landscape dashboard will allow our subscribers to evaluate supply chain risk, including deforestation, monitor ongoing jurisdictional initiatives, screen jurisdictions for possible investment (e.g., high remaining forest, high deforestation), and evaluate EUDR/NDPE risk. Contact us at support@maphubs.com for more information.
Tip of the month
New eTTP Mills Column

The new eTTP Mills column in the Plots Table gives a clear and organized view of all mills and their accompanying eTTP tiers that connect a certain plot to the supply chain. This is a faster approach to figure out why we've linked a plot to a supply chain using our eTTP tiers and how probable it is to be in the chain.
Benefit of the month
Viewing Grievances linked to Plots
Speaking of the plots table, you can easily see the corresponding grievances linked to the plot by scrolling through the datasets on the table. You will be directed to the grievance reports, if any, by simply clicking on them, where you may verify the status and stage of the complaint, as well as any updates made to it.
If you have any questions please contact us at info(at)maphubs.com.